
 EN
EN
 ar
ar bg
bg hr
hr cs
cs da
da nl
nl fi
fi fr
fr de
de el
el hi
hi it
it ko
ko no
no pl
pl pt
pt ro
ro ru
ru es
es sv
sv tl
tl iw
iw id
id lv
lv lt
lt sr
sr sk
sk sl
sl uk
uk vi
vi et
et hu
hu th
th tr
tr fa
fa ms
ms hy
hy ka
ka ur
ur bn
bn mn
mn ta
ta kk
kk uz
uz ku
ku
Web-based Monitoring Software
The platform is compatible with hardware devices from different manufacturers, different types, and different models. Devices can transmit data to the Cloud Platform by wired or wireless means. This matters for engineering owners because monitoring systems are often built in stages. A project may begin with a few sensors, then add acquisition modules, wireless transmission, environmental channels, displacement points, strain points, or water-level instruments later. Kingmach Web-based Monitoring Software gives those devices a shared environment for storage, review, visualization, alarm handling, and reporting.
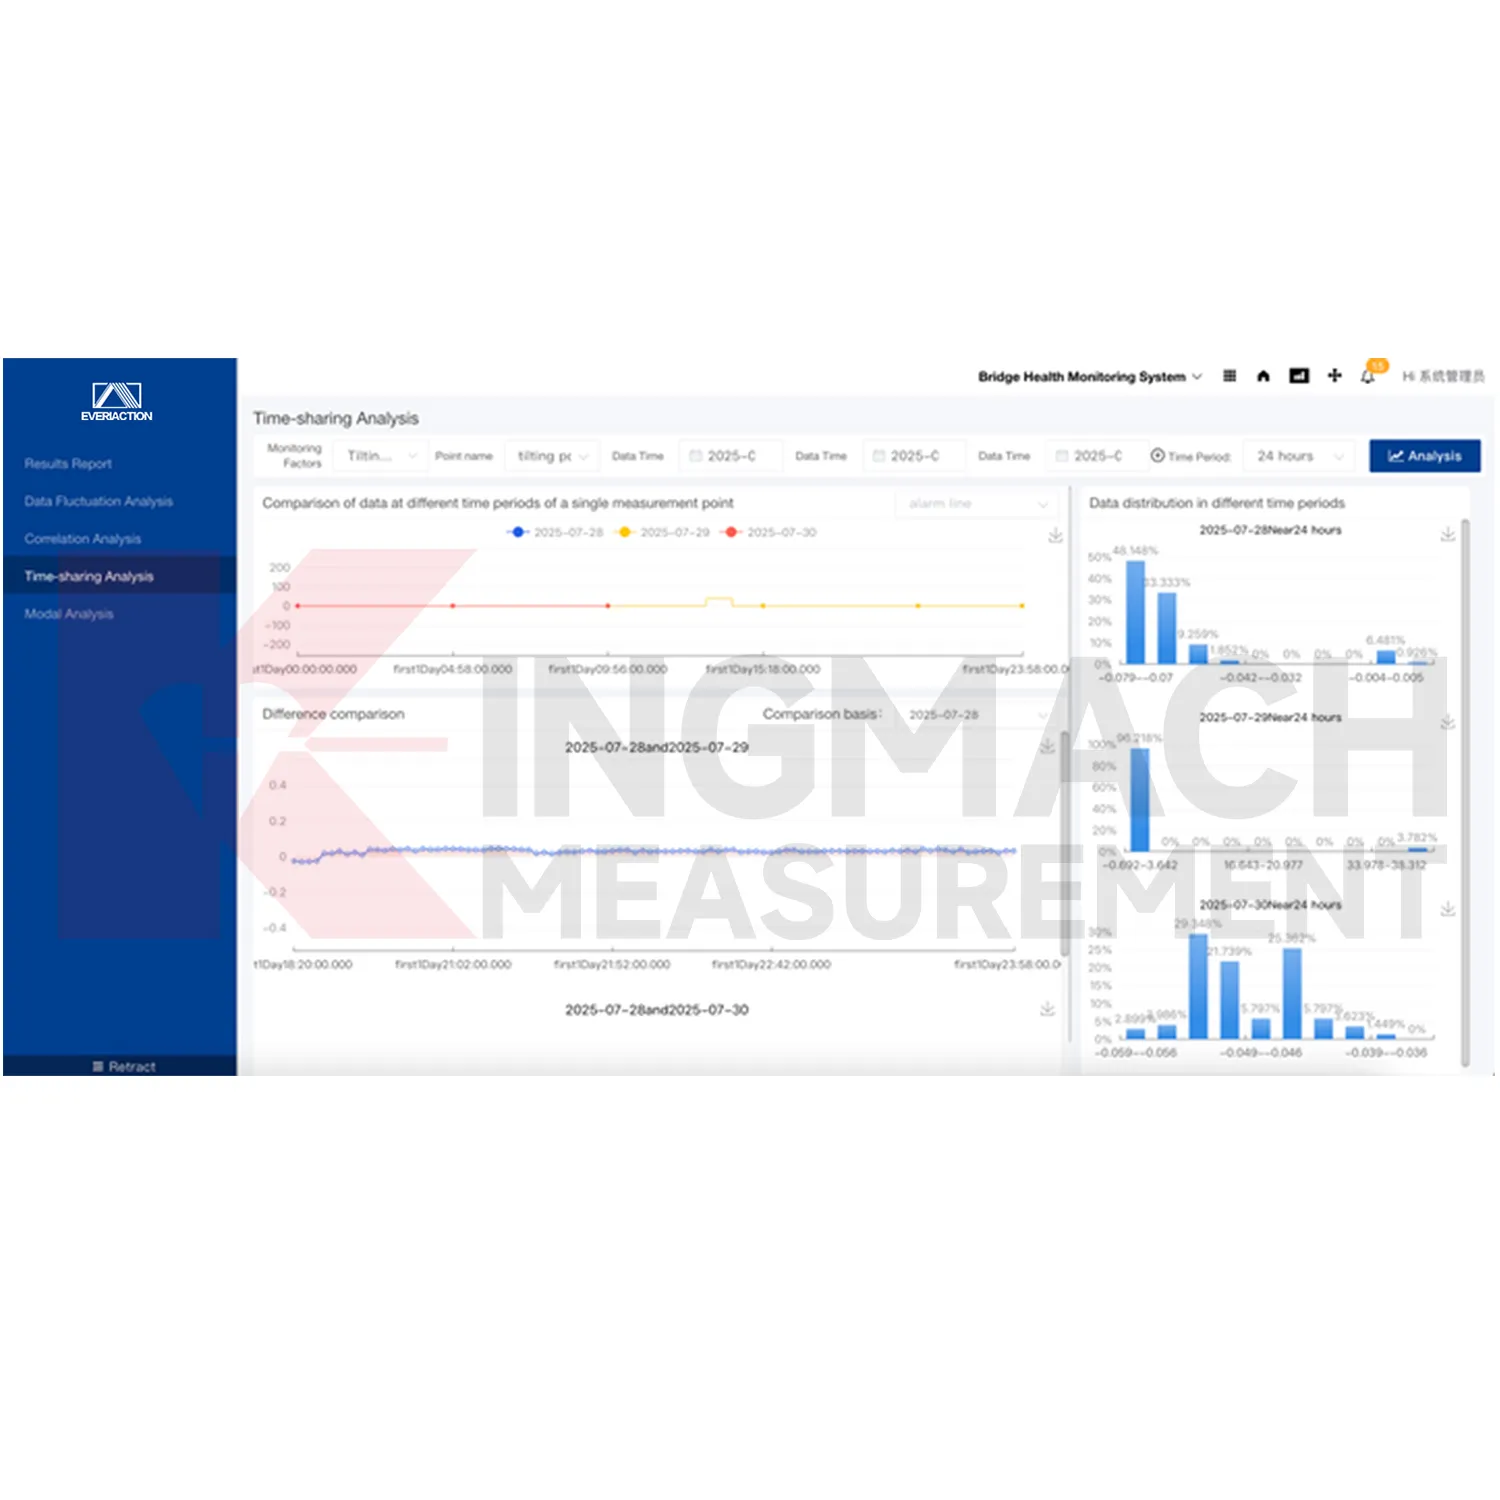
Application of Web-based Monitoring Software
Multi-site asset management uses Kingmach Web-based Monitoring Software when an owner needs consistent monitoring records across several projects. Each project can keep its own basic information, dynamic information, alarm levels, documents, and maintenance records while still following a common digital workflow. This is useful for infrastructure owners, engineering firms, and maintenance teams that manage bridges, tunnels, slopes, buildings, and hydraulic structures at the same time. Standardized visualization and reporting make cross-project review more efficient.
The future of Web-based Monitoring Software
Cloud computing will support wider remote use of Kingmach Web-based Monitoring Software. Owners and engineering teams may need to review assets from offices, field sites, control centers, or mobile workstations. Cloud-based access helps keep monitoring visible even when the structure is difficult to reach. Remote review will not replace field verification, but it can improve timing. Teams can identify which area needs inspection, what related data should be checked, and which documents should be prepared before arriving on site.
Care & Maintenance of Web-based Monitoring Software
Project documents in Kingmach Web-based Monitoring Software should be kept current. Upload or update drawings, point lists, installation photos, inspection notes, maintenance records, alarm response logs, and report files as the project changes. These documents give meaning to the trend curves and alarm history. If a sensor is moved, replaced, recalibrated, or disabled, the platform record should show the date and reason. Future reviewers need that context to interpret long-term monitoring data correctly.
Kingmach Web-based Monitoring Software
The core value of Kingmach Web-based Monitoring Software is not only display. It supports fast storage, real-time filtering, efficient analysis, complex statistics, user-friendly display, and personalized customization of collected data. These functions help convert raw sensor streams into information that can be reviewed by engineers and maintenance teams. A single abnormal point may need trend comparison, related channel review, inspection notes, and alarm history before action is taken. The platform gives those elements a common place, reducing the risk that important context is lost across separate files or devices.
FAQ
Q: Who should receive accounts?
A: Give access only to the owner, operator, engineer, inspector, or reviewer roles that need the platform.
Q: What does an operator need?
A: An operator needs status, active alarms, communication condition, and recent abnormal records.
Q: What does an engineer need?
A: An engineer needs trend comparison, related channels, event notes, and inspection records.
Q: What supports later expansion?
A: Stable project names, point names, device IDs, and channel maps make new device access easier.
Q: What belongs in handover?
A: Provide accounts, permissions, device list, channel map, alarm rules, report setup, backup method, and recent data notes.
Reviews
David Wilson
We purchased displacement transducers and settlement sensors, and the quality exceeded our expectations. Easy installation and reliable performance.
Robert Taylor
The weir flow meter is well-built and delivers accurate measurements. Great value for water management applications.
Latest Inquiries
To protect the privacy of our buyers, only public service email domains like Gmail, Yahoo, and MSN will be displayed. Additionally, only a limited portion of the inquiry content will be shown.
Sophia***@gmail.comUnited Kingdom
Good day, we need environmental monitoring sensors including temperature, humidity, and wind sensors...
Charlotte***@gmail.comUnited Arab Emirates
Hi, we require instrumentation cables suitable for harsh environments. Could you advise on specifica...